Difference between revisions of "ISWC2010 Evaluation"
(→System Architecture) |
(→System Architecture) |
||
| Line 7: | Line 7: | ||
==System Architecture== | ==System Architecture== | ||
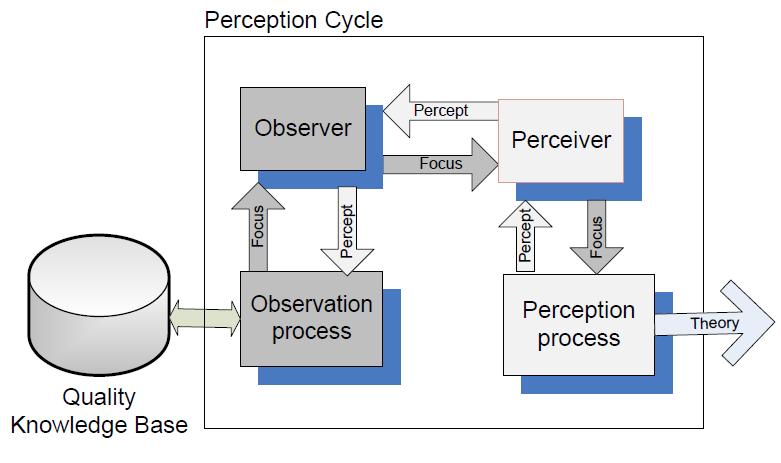
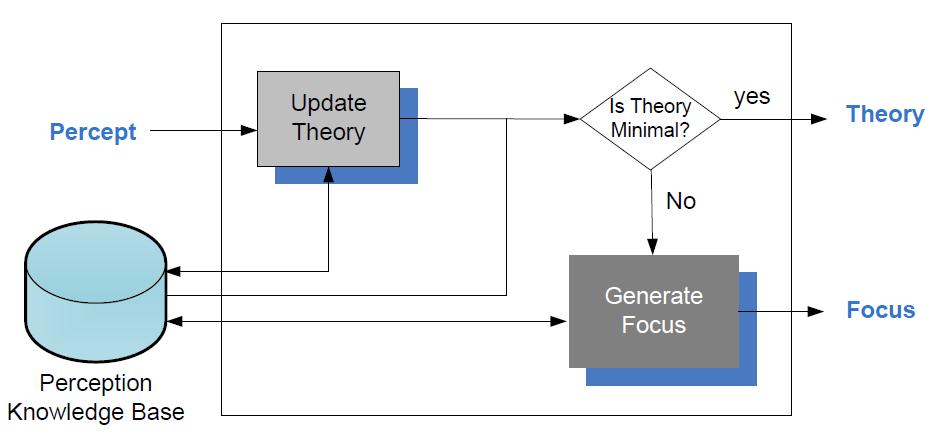
APS system architecture is as shown. | APS system architecture is as shown. | ||
| − | [[Image:perception_cycle.jpg|none| | + | [[Image:perception_cycle.jpg|none|frame|thumbnail|500px|alt = Figure 1. Perception Cycle.]] |
[[Image:perception_process.jpg|none|500px|alt = Figure 2. Perception Process.]] | [[Image:perception_process.jpg|none|500px|alt = Figure 2. Perception Process.]] | ||
Revision as of 01:49, 20 June 2010
Contents
[hide]Linked Sensor Data
LinkedSensorData is an RDF dataset containing expressive descriptions of ~20,000 weather stations in the United States. The data originated at MesoWest, a project within the Department of Meterology at the University of Utah that has been aggregating weather data since 2002.[1] On average, there are about five sensors per weather station measuring phenomena such as temperature, visibility, precipitation, pressure, wind speed, humidity, etc. In addition to location attributes such as latitude, longitude, and elevation, there are also links to locations in Geonames that are near each weather station. This sensors description dataset is now part of the LOD.
Active Perception System [APS]
Active Perception System is a system that is inspired by human perception. This system emulates the human perception cycle and also showcases how a system can take advantage of human perception model in order to achieve efficient use of sensors in order to get a situational awareness with least effort. Effort here refers to tasking sensors to observe some phenomenon and is quantified by their power consumption.
System Architecture
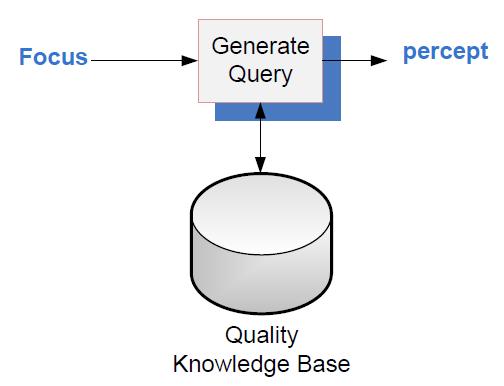
APS system architecture is as shown.
Evaluation
Data Set
We use the observation dataset for running the perception cycle.
Ontologies
The perception ontologies for various radii are given in this section.


