Difference between revisions of "RDF Graph Model"
From Knoesis wiki
(→LDM) |
|||
| Line 67: | Line 67: | ||
=== LDM === | === LDM === | ||
| + | ==== BKR-SP ==== | ||
| + | |||
| + | <gallery perrow=3 widths=320px heights=240px caption="LDM graphs transformed from the BKR-SP dataset"> | ||
| + | File:Ldm_bkr_in.png|In-degree distribution. | ||
| + | File:Ldm_bkr_out.png|Out-degree distribution. | ||
| + | File:Ldm_bkr_total.png|Total-degree distribution. | ||
| + | </gallery> | ||
| + | |||
| + | ==== DBPEDIA ==== | ||
| + | |||
| + | <gallery perrow=3 widths=320px heights=240px caption="LDM graphs transformed from the DBPedia dataset"> | ||
| + | File:Ldm_dbpedia_in.png|In-degree distribution. | ||
| + | File:Ldm_dbpedia_out.png|Out-degree distribution. | ||
| + | File:Ldm_dbpedia_total.png|Total-degree distribution. | ||
| + | </gallery> | ||
| + | |||
| + | ==== FREEBASE ==== | ||
| + | |||
| + | <gallery perrow=3 widths=320px heights=240px caption="LDM graphs transformed from the Freebase dataset"> | ||
| + | File:Ldm_freebase_in.png|In-degree distribution. | ||
| + | File:Ldm_freebase_out.png|Out-degree distribution. | ||
| + | File:Ldm_freebase_total.png|Total-degree distribution. | ||
| + | </gallery> | ||
| + | |||
| + | ==== YAGO2S-SP ==== | ||
| + | |||
| + | <gallery perrow=3 widths=320px heights=240px caption="LDM graphs transformed from the YAGO2S-SP dataset"> | ||
| + | File:Ldm_yago_in.png|In-degree distribution. | ||
| + | File:Ldm_yago_out.png|Out-degree distribution. | ||
| + | File:Ldm_yago_total.png|Total-degree distribution. | ||
| + | </gallery> | ||
=== NLAN === | === NLAN === | ||
Revision as of 05:17, 13 May 2014
Contents
RDF Graph Model
We propose a new formal model for representing any set of RDF triples as mathematical graphs.
Example
| Triple | Subject | Predicate | Object |
|---|---|---|---|
| T1 | BobDylan | isMarriedTo | SaraLownds |
| T2 | BarackObama | isMarriedTo | MichelleObama |
| T3 | isMarriedTo | rdfs:subPropertyOf | isSpouseOf |
| T4 | BobDylan | isSpouseOf | SaraLownds |
| T5 | BarackObama | isSpouseOf | MichelleObama |
For the set of RDF triples in the table above, we explain how each approach represents them in the graph.
The NLAN model

The BI model

eI_i
The LDM model

More complex examples
Singleton_Property approach to representing

Empirical studies
RDF Datasets
Degree distributions
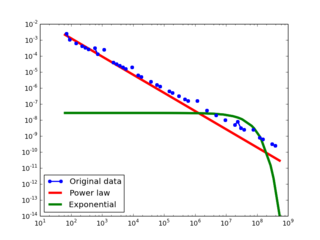
LDM
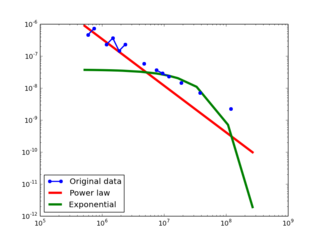
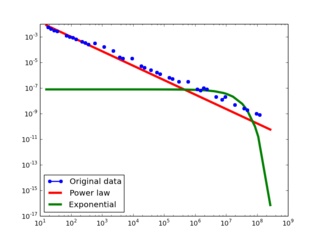
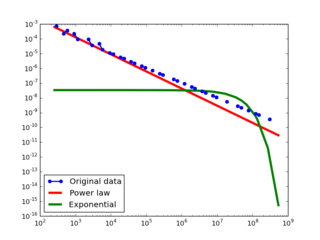
BKR-SP
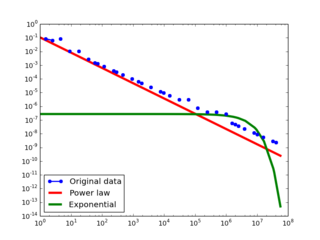
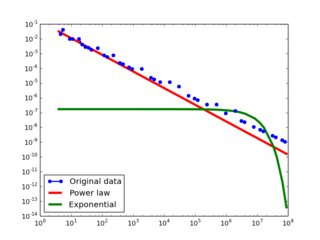
- LDM graphs transformed from the BKR-SP dataset
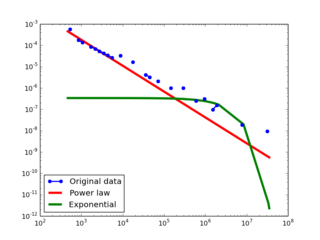
In-degree distribution.
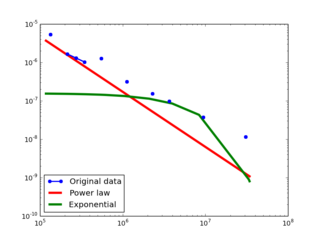
Out-degree distribution.
Total-degree distribution.


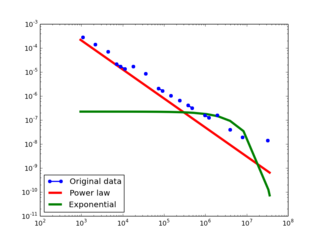
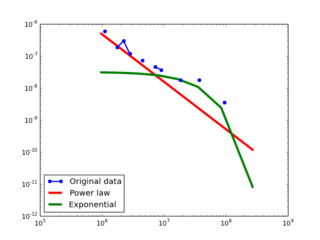
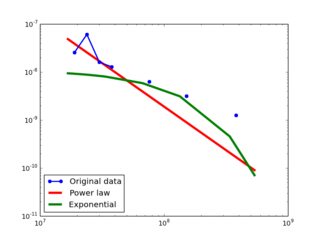
DBPEDIA
- LDM graphs transformed from the DBPedia dataset
In-degree distribution.
Out-degree distribution.
Total-degree distribution.


FREEBASE
- LDM graphs transformed from the Freebase dataset
In-degree distribution.
Out-degree distribution.
Total-degree distribution.


YAGO2S-SP
- LDM graphs transformed from the YAGO2S-SP dataset

In-degree distribution.
Out-degree distribution.
Total-degree distribution.


