Difference between revisions of "Intellego"
(Created page with '==Ontology of Perception: A Semantic Web Approach to Enhance Machine Perception== Today, many sensor networks and their applications employ a brute force approach to collecting a…') |
|||
| (8 intermediate revisions by the same user not shown) | |||
| Line 1: | Line 1: | ||
| − | ==Ontology of Perception: | + | ==Ontology of Perception: <strong>IntellegO</strong>== |
| − | + | <i>Intellego (Greek: "to perceive")</i> | |
| + | Today, many sensor networks and their applications employ a brute force approach to collecting and analyzing sensor data. Such an approach often wastes valuable energy and computational resources by unnecessarily tasking sensors and generating observations of minimal use. People, on the other hand, have evolved sophisticated mechanisms to efficiently perceive their environment. One such mechanism includes the use of background knowledge to determine what aspects of the environment to focus our attention. In this project, we develop an ontology of perception, IntellegO, that may be used to more efficiently convert observations into perceptions. IntellegO is derived from cognitive theory, encoded in set-theory, and provides a formal semantics of machine perception. | ||
| − | |||
| − | + | ==Formal Specification== | |
| − | + | The formal specification of IntellegO is encoded in set-theory; which provides a notation that is unambiguous, well-established, and suitably expressive. | |
| − | + | [[Image:Intellego-in-set-theory.png|none|thumb|500px|]] | |
| − | + | ||
| − | [[Image: | + | |
| − | + | ||
| − | + | ||
| − | + | ||
==Ontologies and Knowledge Bases== | ==Ontologies and Knowledge Bases== | ||
| − | + | The implementation of IntellegO used in our evaluations utilizes and integrates a suite of ontologies and knowledge bases. | |
| − | [ | + | * [http://sonicbanana.cs.wright.edu/ssw/ont/intellego-owl.owl IntellegO-OWL] - An encoding of the terminology of IntellegO in OWL, with a mapping of terms to the SSN Ontology. |
| − | + | * [http://purl.oclc.org/NET/ssnx/ssn Sensor and Sensor Network (SSN) Ontology] - An ontology developed by the ([http://www.w3.org/2005/Incubator/ssn/wiki/ W3C Semantic Sensor Networks Incubator Group]) to describe sensors and sensor observations. | |
| + | * [http://sonicbanana.cs.wright.edu/ssw/ont/weather.owl Weather Ontology] - An ontology describing background knowledge related to the domain of weather. | ||
| + | * [http://linkedsensordata.com Linked Sensor Data] - A knowledge base on LOD which includes descriptions of over 20,000 active sensors and over 160 million sensor observations; resulting in over 1.7 billion facts (statements) related to major weather events in the United States. | ||
| − | |||
| − | |||
| − | |||
| − | |||
| − | |||
| − | |||
| − | |||
| − | |||
| − | |||
| − | |||
| − | |||
| + | ==Focus Evaluation== | ||
| + | Between April 1st and April 6th of 2003, a major blizzard hit the state of Nevada. Environmental data within the surrounding area was collected by weather-stations, encoded as RDF, and made accessible on the Web. This data has been converted to RDF and is accessible as Linked Data (ref:linked sensor data). For every two hour interval from April 1st through April 6th of 2003, and for each observer within a 400 mile radius of the blizzard, we execute the perception-cycle and generate a perceptual-theory. For each execution of the perception-cycle, the observer is a weather-station and the resulting perceptual-theory contains member entities representing the weather event occurring at that time and location (of the weather station). After each execution, the resultant perceptual-theory is checked for correctness and the total number of percepts, in the set of percepts, is counted. Below, we show some statistics and trends, and provide the datasets generated by this evaluation. | ||
| − | |||
| − | + | <strong>Percepts Generated during Evaluation: # and %</strong> | |
| + | <i>(p = precipitation, t = temperature, w = wind speed)</i> | ||
| − | + | 25 miles (17 observers) | |
| + | [[Image:25-miles.PNG|none|thumb|700px|]] | ||
| + | 50 miles (70 observers) | ||
| + | [[Image:50-miles.PNG|none|thumb|700px|]] | ||
| + | 100 miles (170 observers) | ||
| + | [[Image:100-miles.PNG|none|thumb|700px|]] | ||
| + | 200 miles (373 observers) | ||
| + | [[Image:200-miles.PNG|none|thumb|700px|]] | ||
| + | 400 miles (516 observers) | ||
| + | [[Image:400-miles.PNG|none|thumb|700px|]] | ||
| − | |||
| − | |||
| + | <strong>Percepts Generated during Evaluation: Trends</strong> | ||
| − | + | Percepts (Observed Discriminating Qualities) | |
| − | [[Image: | + | [[Image:Trend-percepts.PNG|none|thumb|600px|]] |
| − | + | Extraneous Qualities (Not Observed) | |
| − | [[Image: | + | [[Image:Trend-extraneous.PNG|none|thumb|600px|]] |
| − | + | ||
| − | + | ||
| − | + | ||
| − | + | ||
| − | + | ||
| − | + | ||
| − | + | <strong>Perceptual-Theories Generated during Evaluation</strong> | |
| + | [[Image:Trend-theories.PNG|none|thumb|600px|]] | ||
| − | |||
| − | |||
| − | |||
| − | |||
| + | <strong>Evaluation Datasets</strong> | ||
| − | + | The data generated during the evaluation was annotated used a slightly older version of Intellego (which can be found [http://sonicbanana.cs.wright.edu/ssw/ont/perception.owl here]). | |
| − | [[ | + | *[http://sonicbanana.cs.wright.edu/activeperception/all_active_25miles.zip 25 miles (17 observers)] |
| + | *[http://sonicbanana.cs.wright.edu/activeperception/all_active_50miles.zip 50 miles (70 observers)] | ||
| + | *[http://sonicbanana.cs.wright.edu/activeperception/all_active_100miles.zip 100 miles (170 observers)] | ||
| + | *[http://sonicbanana.cs.wright.edu/activeperception/all_active_200miles.zip 200 miles (373 observers)] | ||
| + | *[http://sonicbanana.cs.wright.edu/activeperception/all_active_400miles.zip 400 miles (516 observers)] | ||
Latest revision as of 15:08, 20 June 2011
Contents
Ontology of Perception: IntellegO
Intellego (Greek: "to perceive")
Today, many sensor networks and their applications employ a brute force approach to collecting and analyzing sensor data. Such an approach often wastes valuable energy and computational resources by unnecessarily tasking sensors and generating observations of minimal use. People, on the other hand, have evolved sophisticated mechanisms to efficiently perceive their environment. One such mechanism includes the use of background knowledge to determine what aspects of the environment to focus our attention. In this project, we develop an ontology of perception, IntellegO, that may be used to more efficiently convert observations into perceptions. IntellegO is derived from cognitive theory, encoded in set-theory, and provides a formal semantics of machine perception.
Formal Specification
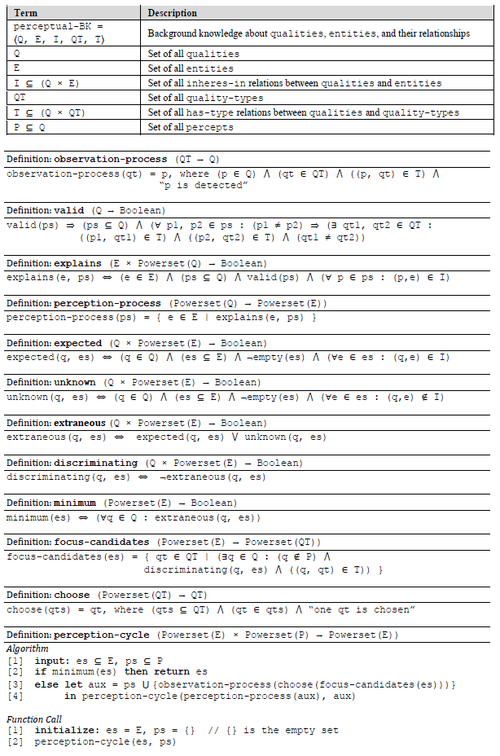
The formal specification of IntellegO is encoded in set-theory; which provides a notation that is unambiguous, well-established, and suitably expressive.
Ontologies and Knowledge Bases
The implementation of IntellegO used in our evaluations utilizes and integrates a suite of ontologies and knowledge bases.
- IntellegO-OWL - An encoding of the terminology of IntellegO in OWL, with a mapping of terms to the SSN Ontology.
- Sensor and Sensor Network (SSN) Ontology - An ontology developed by the (W3C Semantic Sensor Networks Incubator Group) to describe sensors and sensor observations.
- Weather Ontology - An ontology describing background knowledge related to the domain of weather.
- Linked Sensor Data - A knowledge base on LOD which includes descriptions of over 20,000 active sensors and over 160 million sensor observations; resulting in over 1.7 billion facts (statements) related to major weather events in the United States.
Focus Evaluation
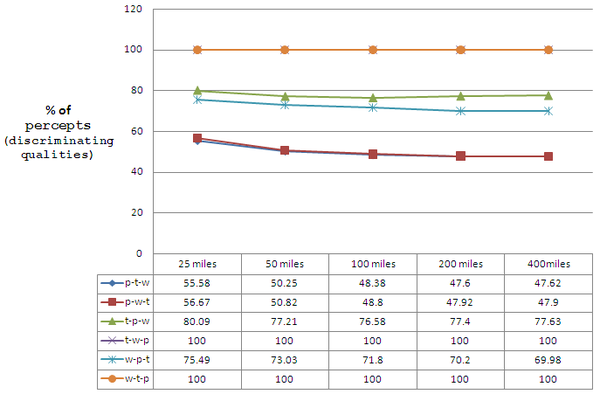
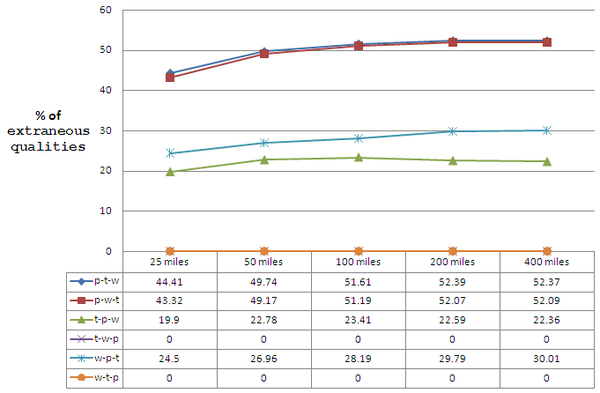
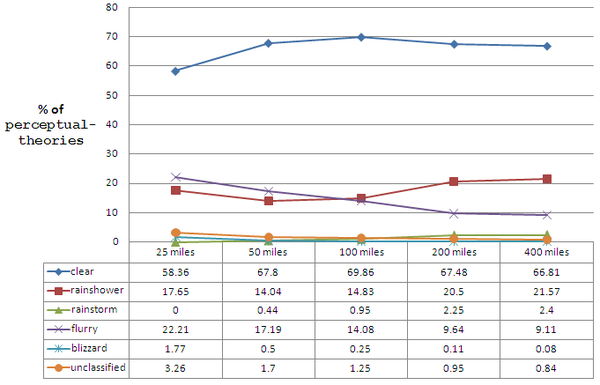
Between April 1st and April 6th of 2003, a major blizzard hit the state of Nevada. Environmental data within the surrounding area was collected by weather-stations, encoded as RDF, and made accessible on the Web. This data has been converted to RDF and is accessible as Linked Data (ref:linked sensor data). For every two hour interval from April 1st through April 6th of 2003, and for each observer within a 400 mile radius of the blizzard, we execute the perception-cycle and generate a perceptual-theory. For each execution of the perception-cycle, the observer is a weather-station and the resulting perceptual-theory contains member entities representing the weather event occurring at that time and location (of the weather station). After each execution, the resultant perceptual-theory is checked for correctness and the total number of percepts, in the set of percepts, is counted. Below, we show some statistics and trends, and provide the datasets generated by this evaluation.
Percepts Generated during Evaluation: # and %
(p = precipitation, t = temperature, w = wind speed)
25 miles (17 observers)
50 miles (70 observers)
100 miles (170 observers)
200 miles (373 observers)
400 miles (516 observers)
Percepts Generated during Evaluation: Trends
Percepts (Observed Discriminating Qualities)
Extraneous Qualities (Not Observed)
Perceptual-Theories Generated during Evaluation
Evaluation Datasets
The data generated during the evaluation was annotated used a slightly older version of Intellego (which can be found here).


