Hierarchical Interest Graph
Contents
Abstact
Industry and researchers have identified numerous ways to monetize microblogs for personalization and recommendation. A common challenge across these different works is identification of user interests. Although techniques have been developed to address this challenge, a flexible approach that spans multiple levels of granularity in user interests has not been forthcoming.
In this work, we focus on exploiting hierarchical semantics of concepts to infer richer user interests expressed as Hierarchical Interest Graph. To create such graphs, we utilize user's Twitter data to first ground potential user interests to structured background knowledge such as Wikipedia Category Graph. We then use an adaptation of spreading activation theory to assign user interest score (or weights) to each category in the hierarchy. The Hierarchical Interest Graph not only comprises of user's explicitly mentioned interests determined from Twitter, but also their implicit interest categories inferred from the background knowledge source. We demonstrate the effectiveness of our approach through a user study which shows an average of approximately eight of the top ten weighted categories in the graph being relevant to a given user's interests.
Approach
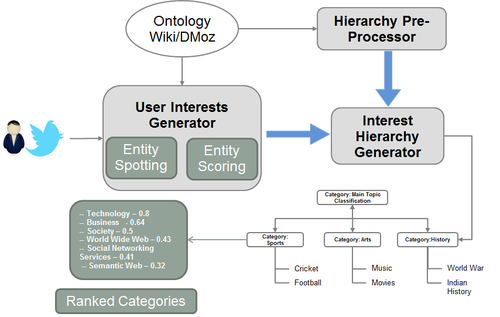
The goal of our approach is to construct a Hierarchical Interest Graph (HIG) for a Twitter user. To accomplish this our system performs the following steps:
- Hierarchy Pre-processor converts the Wikipedia Category Graph (WCG) into a hierarchy
- User Interests Generator spots and scores the Primitive Interests from tweets of a user.
- Interest Hierarchy Generator maps the scored Primitive Interests to Wikipedia Hierarchy to infer the HIG of the user.
Step 1 of our approach is performed if and when there are updates to Wikipedia Category Graph. Step 2 and 3 are performed for the set of tweets of each user to generate the corresponding HIG. Below Figure illustrates our approach.
Evaluation
The evaluation was done with three variations of spreading activation theory used in our approach. The three activation functions are as follows;
- Bell: Normalizes the propagated value based on the number of nodes in the next level of specificity.
- Bell Log: Builds upon Bell by reducing the impact with Log based reduction.
- Priority Intersect: Builds upon Bell Log with prioritizing the most suitable categories and boosting the entity-intersecting nodes.
In order to evaluate our system we conducted a users study. Attracting participants for a user study was difficult. Although 40 people agreed to participate in the user study, 37 of those responded. We created a set of the top 50 interest categories that were the outcome of the above mentioned variations of our approach. The users marked yes/no/maybe based on their level of interest for the appropriate categories.
User Study Analysis
The user study stats are shown in the below table. Following the stats we discuss some analysis of the user study data.
| Users | Tweets | Entities | Distinct Entities | Tweets with Entities | Interests Categories | |
|---|---|---|---|---|---|---|
| Total | 37 | 31,927 | 29,146 | 13,150 | 16,464 | 111,535 |
| Average | 864 | 787 | 355 | 445 | 3014 |
Distribution of Resolved Entities
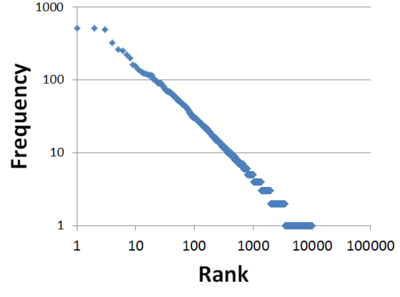
As shown in the above table, we were able to resolve around 30K entities using Zemanta<ref>http://developer.zemanta.com/</ref>. The distribution of these extracted entities are shown in the Figure on the left (Media:Entity-distribution.png). The graph is a log-log scale with x-axis representing the rank of the entity based on its occurrence and the y-axis represents the frequency of its occurrence among the 37 users. Not surprisingly the distribution follows a power law<ref>Adamic, Lada A. "Zipf, power-laws, and pareto-a ranking tutorial." Xerox Palo Alto Research Center, Palo Alto, CA</ref>.
Users-Tweets-Entities-Categories Distribution
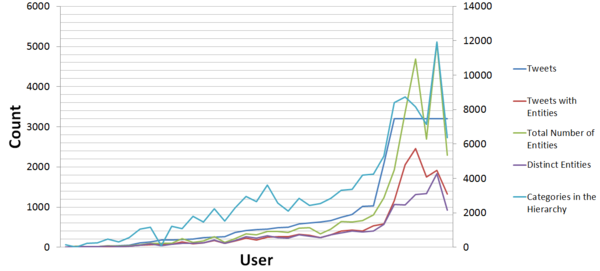
In the Figure on the right, we can see the distribution based on users. The x-axis are users ordered based on the number of tweets (ascending). The graph comprises of the distribution of the following:
- Number of Tweets of each user
- Tweets comprising atleast one entity per user
- Entities per user
- Distinct Entities per user
- Categories of Interest generated by our best variation (Priority Intersect)
We can derive some insights from the figure related to our approach:
- The total number of categories generated by the system does not show a proportional increase with that of the number of tweets with a user. However, we can see a co-relation (better to provide formal evidence) between the distinct entities of each user to that of the number of categories generated for the user. This shows that the number of interest categories inferred from Wikipedia Hierarchy (bigger sub-graph) is based on the diversity of topics the user discusses in his/her tweets.
References
<references />


